Car and Truck Parking Systems
Santa Monica Public Parking Lots and Structures at Capacity
OVERVIEW
People in Los Angeles spend a lot of time in their cars, and a lot of time talking about parking and traffic.I spend a lot of time in Santa Monica, and so focused on this area when developing the project. The full title of this project is: Santa Monica Public Parking Lots and Structures at Capacity.

PROCESS
To follow the project brief it was critical to be able to link what I created back to the real world system. Geography of lots and structures were broken up into four distinct groups by color. These represent the four groups that the City of Santa Monica designated.
Cyan = Beach and Pier Parking
Magenta = Main Street Parking
Yellow = Downtown Parking
Black = Mid-City Parking
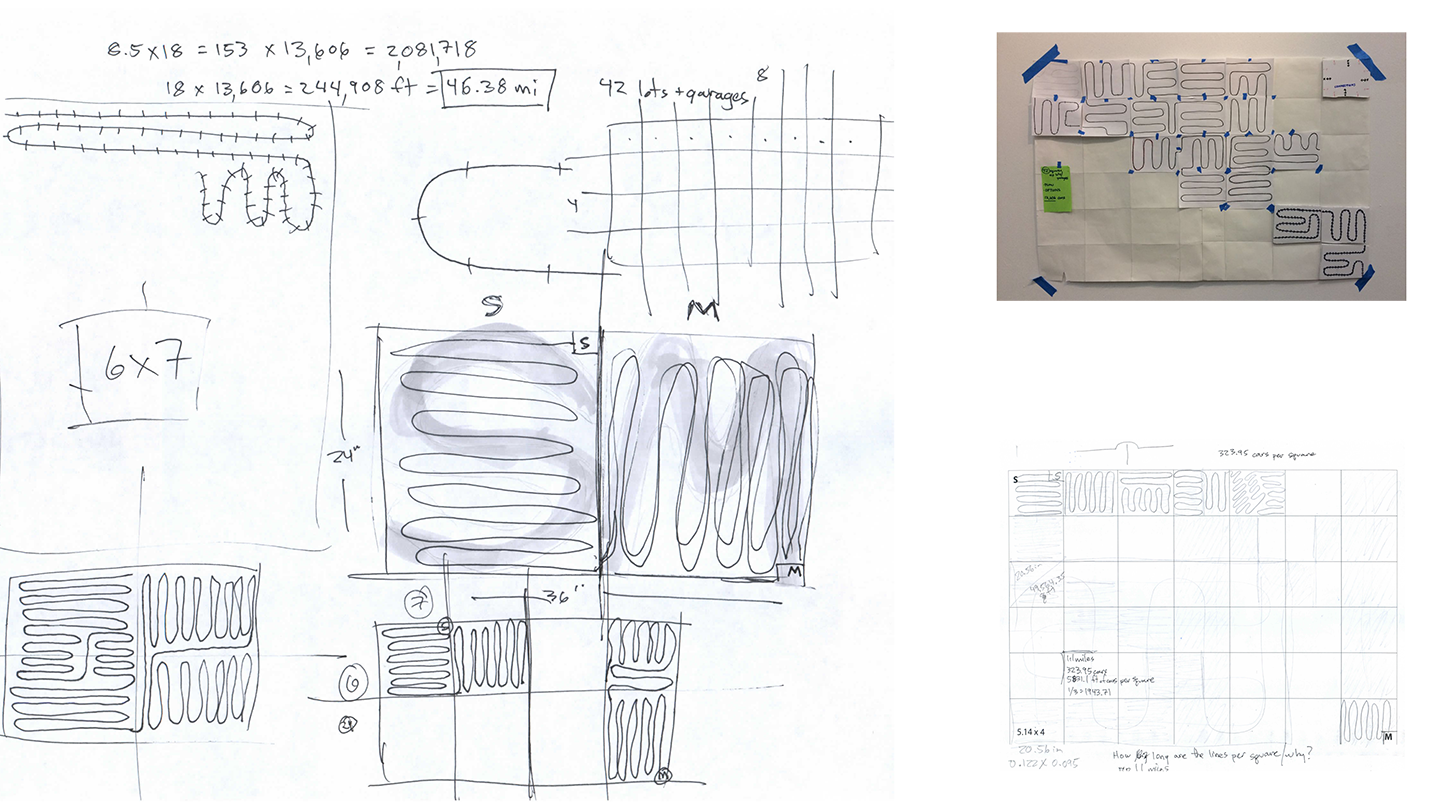
The capacity of quantity of cars per lot and structure were researched and plugged into a spreadsheet. I then translated a geographic map of the location of the lots and structures into a grid. The spreadsheet and grid were combined to create the guiding legend (below left) and turned into a graphical representation (bottom right). I began by prototyping on a 24 x 36 piece of paper, which was to be the final assignment size, in order to understand the scale. After several sketches revealed a direction to pursue, I digitized and iterated upon the idea in Adobe Illustrator. There I played with positive and negative space as well as different color combinations before arriving at the final image found at the top of this page.


STATS
42 parking lots and structures
13,606 parking spaces
8.5 x 18 parking spaces (153 sq/ft)
244,908 feet bumper to bumper (18 ft per car)
46.38 miles bumper to bumper
323.95 cars avg per square
1.10 miles (5831.1 ft) bumper to bumper avg per square
MATERIALS AND TOOLS
Pen, pencil, marker
Adobe Illustrator
PROJECT BRIEF:
The System Drawing assignment is to produce a drawing that has compositional and design integrity – while rigorously conforming to the specific rules and constraints of your given system. A “rule” could be a relational or formal constraint, for example. The rules are observable qualities that characterize an essential aspect of your system.
Each drawing should have a subject – in this case, a fact or statistic that provides a conceptual constraint to your decisions. This subject does not need to be too complicated. Ideally, there might be something interesting about your chosen fact or subject, where the scale or complexity of your drawing might contribute something to the significance of your subject.
CLASS
Dev Projects I - Systems Drawing
INSTRUCTOR
Tim Durfee